The importance of microglia for neurodegenerative diseases is well-known and these cells are therefore frequently used as a target for new pharmacological interventions.
Phagocytosis of misfolded or aggregated proteins is a key target that can be effectively studied in vitro.
Amyloid-β
Addition of Aβ1-42 coupled to pH-sensitive pHrodo™ Red label to isolated adult microglial cells of 5xFAD mice allows to monitor uptake and lysosomal degradation, measurable as increasing red fluorescence in the Incucyte® Livecell imaging system.
Already 8 h after adding pHrodo™Red-labelled Aβ1-42, 5xFAD microglia show more than doubled fluorescence intensity compared to age-matched non-transgenic microglia, reflecting intense phagocytosis of Aβ in the 5xFAD microglia (Figure 1A). Although also non-transgenic microglia show phagocytosis of Aβ1-42, this extremely strong phagocytotic response of 5xFAD microglia persisted with time and was at the end confirmed by measuring remaining Aβ1-42 in the supernatant of the cells. 5xFAD microglia took up significantly more Aβ1-42 compared to non-transgenic microglia observable as significantly reduced Aβ1-42 in the supernatant (Figure 1B).

Figure 1: Assessment of Aβ1-42 phagocytosis in isolated adult microglia of 5xFAD and non-transgenic (ntg) animals. Aβ1-42 phagocytosis was measured for 48 h using pHrodo™ Red-labelled Aβ1-42 and Incucyte® Livecell imaging (A). After 48 h of incubation, the supernatant of the same cells was analyzed for remaining Aβ1-42 (B). n=5 per group. Mean ± SEM. A: Two-way ANOVA with Bonferroni’s post hoc test. B: Two-tailed unpaired t-test; ***p<0.001.
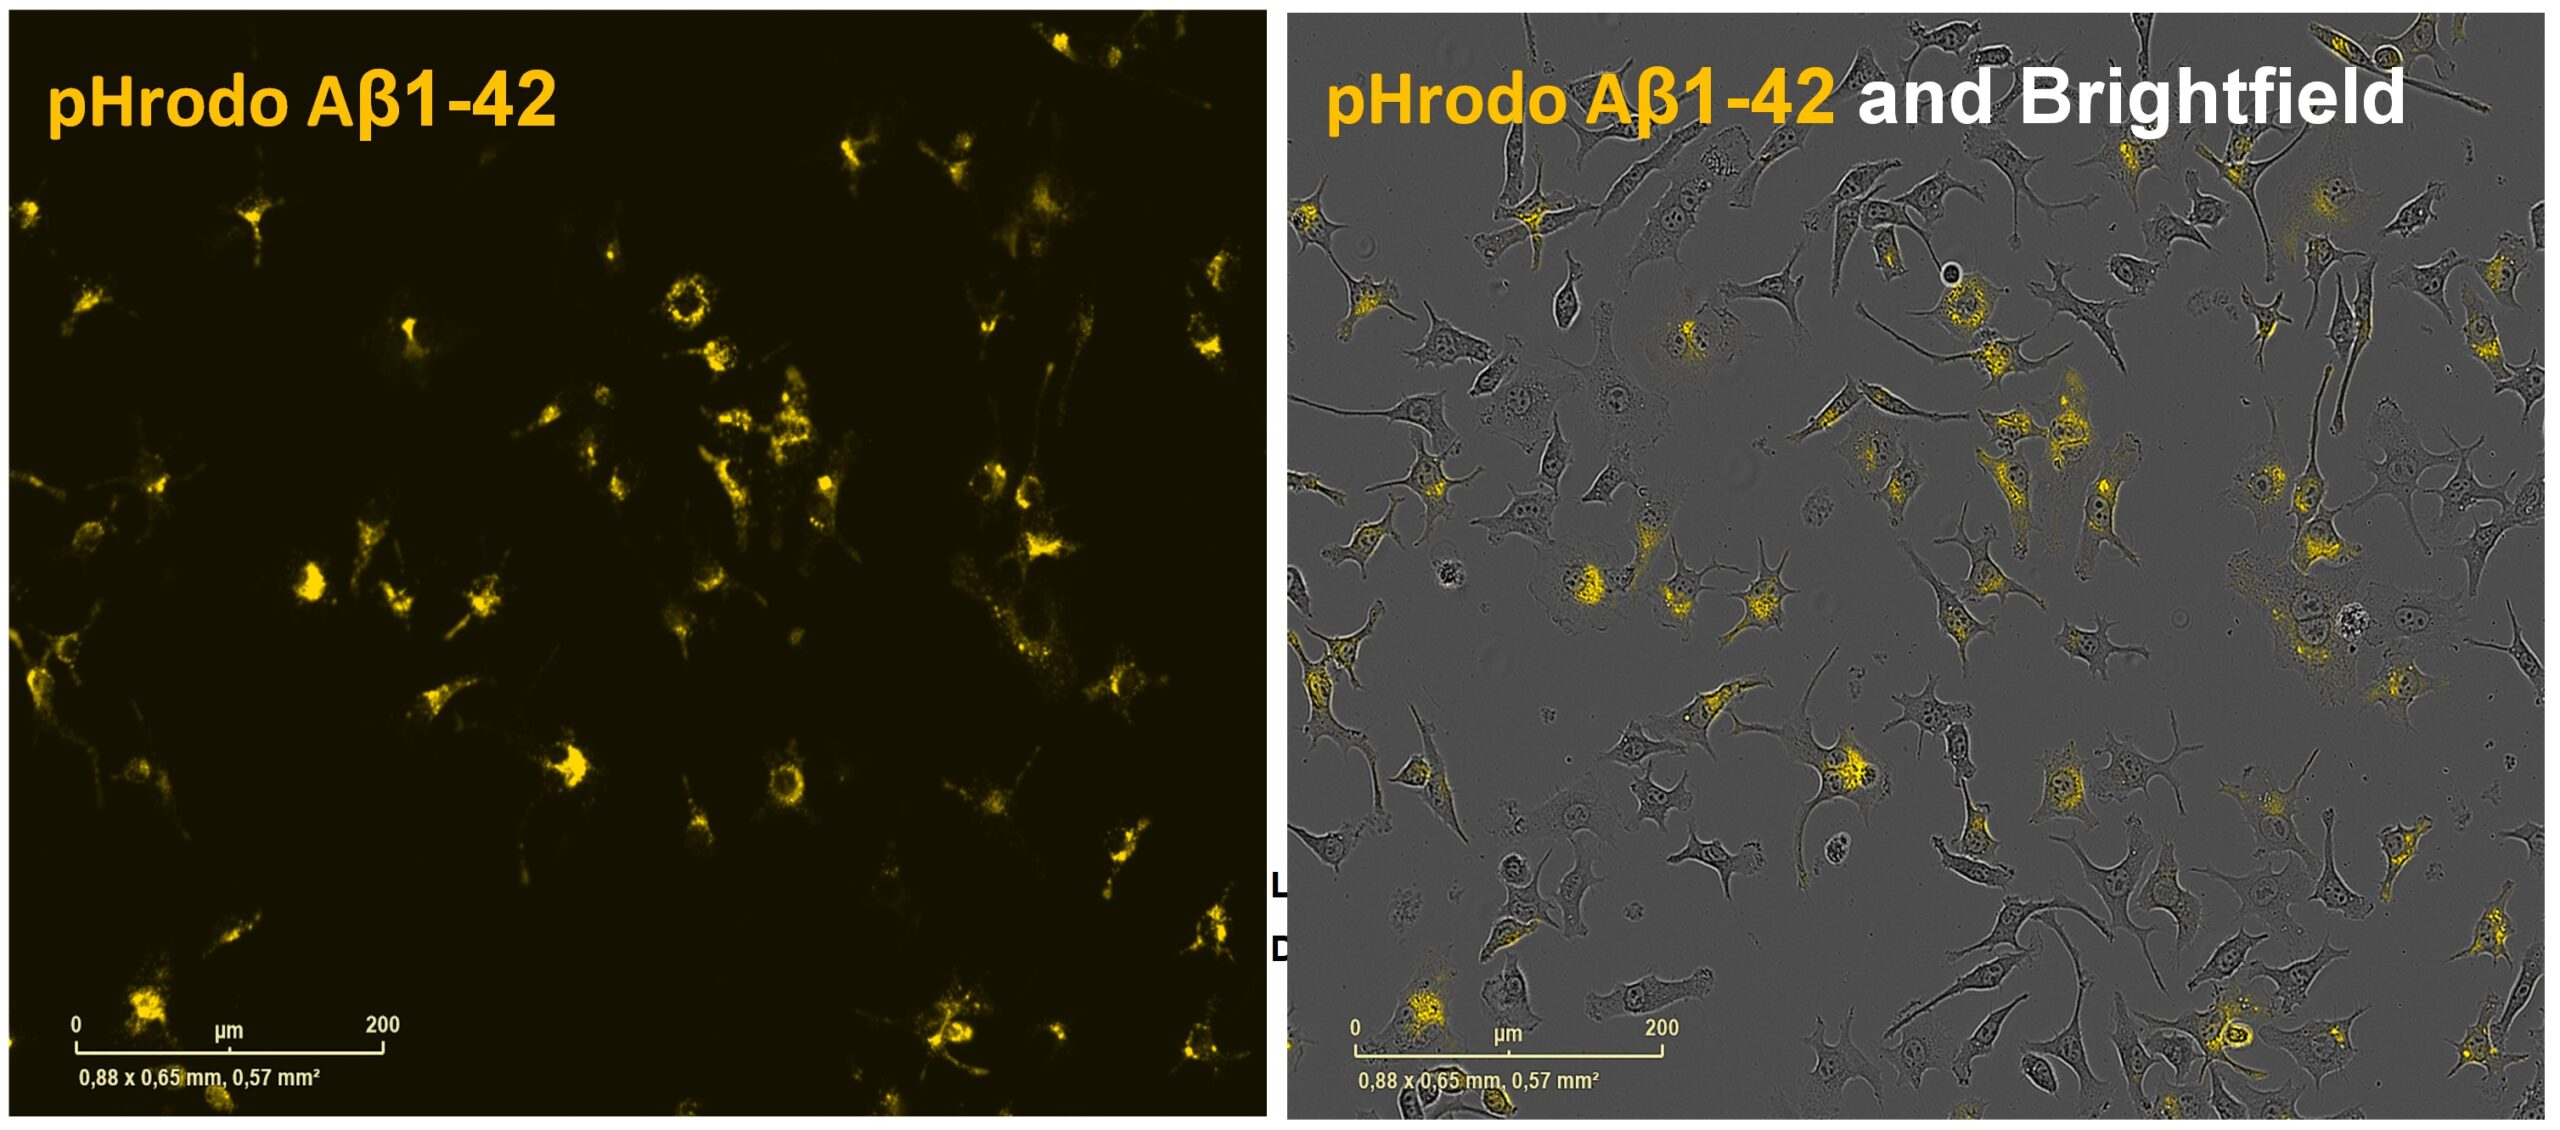
Alternatively, also early postnatal primary microglia, the murine microglial cell line BV2 (Figure 2) or iPSC-derived microglia can be used in the pHrodo™ Red phagocytosis assay for the assessment of Aβ1-42 uptake in response to compound treatment.

Figure 2: Assessment of Aβ1-42 phagocytosis in BV-2 cells using pHrodo™ Red-labelled Aβ1-42 and Incucyte® Livecell imaging. Representative images showing orange fluorescence in BV-2 cells incubated with pHrodo™ Red-labelled Aβ1-42 after 4 h. Scale bar 200 µM.
Tau Pre-Formed Fibrils
Similar to aggregated Aβ, also pre-formed tau fibrils (PPFs) can be labelled with pHrodo™ Red for live monitoring of phagocytosis.
In this set up, tau PFFs were incubated with an anti-tau dGAE (297-391) antibody as positive control or one of two different negative controls (RI1 and RI2) and added to iPSC-derived microglia to monitor differences in phagocytosis of tau PPFs (Figure 3).

Figure 3: Phagocytosis of tau dGAE (297-391) pre-formed fibrils (PFFs) SPR-461. Phagocytosis of pHrodo™ Red-labelled SPR-461 PFFs of iPSC-derived microglial cells in presence and absence of TI (anti-human truncated tau fragment (AA297-391; dGAE) polyclonal antibody SPC-806D) and RI (RI1: Novus Biologicals IgG Fc fragment antibody NBP2-47132; RI2: InVivoPlus human IgG1 isotype control BP0297). A: Number of orange objects and B: Total integrated intensity of the orange signal was monitored over time for 12 h in cells treated with pHrodo™ Red-labelled PFFs alone (VC) or in combination with TI or RI. Mean ± SEM (n=6). Two-way ANOVA followed by Dunnett’s multiple comparison test versus VC for every time point. *p<0.05; **p<0.01; ***p<0.001.
α-synuclein Pre-Formed Fibrils
To assess phagocytotic activity in the context of Parkinsons disease, human iPSC-derived microglia were incubated with pHrodo™ Red-labelled pre-formed α-synuclein fibrils (PPFs).
PPFs were incubated with rabbit anti-human α-synuclein polyclonal antibody SPC-800D as positive control or one of two different negative controls (RI1 and RI2) to observe differences in phagocytosis of α-synuclein PPFs (Figure 4).

Figure 4: Phagocytosis of N-terminally acetylated α-synuclein (α-syn) pre-formed fibrils (type 1; PFFs) SPR-332. Phagocytosis of pHrodo™ Red-labelled SPR-332 PFFs of iPSC-derived microglial cells in presence and absence of TI (rabbit anti-human α-synuclein polyclonal antibody; SPC-800D) and RI (RI1: Novus Biologicals IgG Fc fragment antibody NBP2-47132; RI2: InVivoPlus human IgG1 isotype control BP0297). A: Number of orange objects and B: Total integrated intensity of the orange signal was monitored over time for 12 h in cells treated with pHrodo™ Red-labelled PFFs alone (VC) or in combination with TI or RI. Mean ± SEM (n=6). Two-way ANOVA followed by Dunnett’s multiple comparison test versus VC for every time point. *p<0.05; **p<0.01; ***p<0.001.
Furthermore, labelling of other disease-relevant peptides and proteins with pHrodo™ Red is possible.
Adult as well as early postnatal primary microglial cells of 5xFAD mice, the murine microglial cell line BV-2, and iPSC-derived microglia are therefore well-suited to study phagocytosis of different aggregates in vitro.
Scantox offers a custom-tailored study design for the analysis of phagocytosis, and we are flexible to accommodate to your special interest. We are also happy to advise you and propose study designs.
We are happy to evaluate the efficacy of your compound on phagocytosis!
You might also be interested in these related topics:
- Human iPSC-Derived Microglia
- Organotypic Hippocampal Brain Slices
- Primary Mouse Microglia
- BV-2 Cells
We are happy to receive your inquiry.


