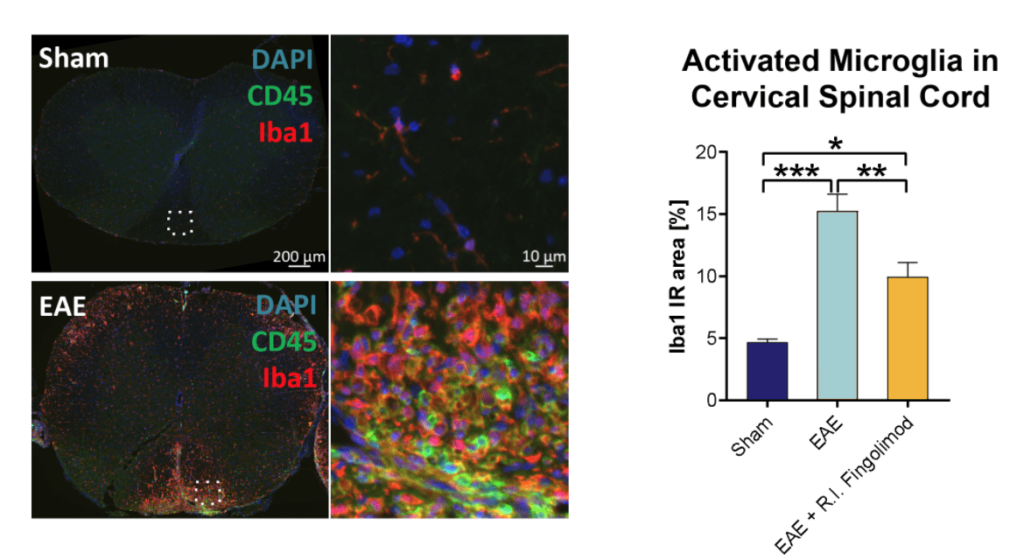
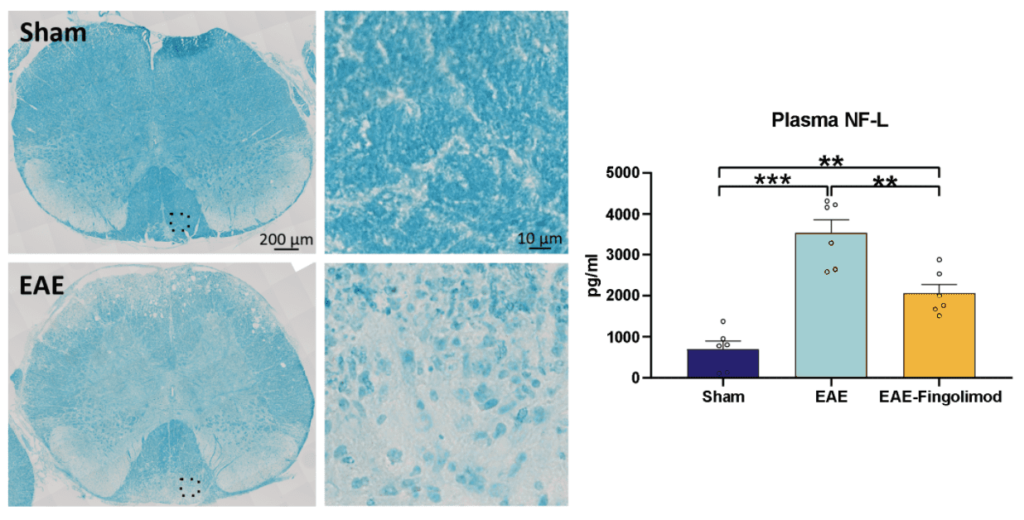
Multiple Sclerosis (MS) is a human specific disease and represents one of the most common neurological disorders among young adults. Although there is a broad range of neurological symptoms and different disease progressions, key hallmarks are demyelination, neuroinflammation, and neurodegeneration resulting in persistent invalidity. To model and test new drugs against MS, the Experimental Autoimmune Encephalomyelitis (EAE) model is frequently used. Here we treated 10 week old female C57Bl/6 mice with MOG and pertussis toxin to induce EAE and evaluated neuroinflammation and demyelination in the cervical spinal cord. One EAE-induced group was further chronically treated with Fingolimod as reference item to prevent pathology. We can show, that EAE induction causes strong inflammation in the cervical spinal cord as indicated by increased CD45 (Fig.1, representative images) and Iba1 levels (Fig.1). Treatment with Fingolimod was able to reduce neuropathological features of the model and is thus a valuable positive control. Evaluation of myelination in the same animals show a strong reduction of myelin in EAE-induced mice compared to sham-treated animals (Fig.2). Additional analysis of neurofilament-light chain (NF-L) levels in the plasma showed highly increased levels caused by EAE induction that can be prevented by Fingolimod treatment (Fig2).

Figure 1. Neuroinflammation in the cervical spinal cord. Representative images of an immunofluorescent labelling showing leukocytes by CD45 labelling, activated microglia by Iba1 labelling and DAPI to counterstain for nuclei in a sham-treated and an EAE-induced mouse. Graphs show immunoreactive area in percent of Iba1 in the white matter of the cervical spinal cord of sham-treated, EAE-induced and EAE-induced mice that were additionally treated with Fingolimod. Graph presents means of immunofluorescent signal measured within the region of interest of 1-2 spinal cord sections per mouse (n = 6-8 per group). One-way ANOVA followed by Bonferroni’s post hoc test. Mean + SEM. *p<0.05; **p<0.01; ***p<0.001.

Figure 2. Neurodegenerative processes in the EAE mouse model. Representative images of a Luxol Fast Blue staining showing myelin in a sham-treated and an EAE-induced mouse. The weaker staining in the EAE-induced mouse indicates demyelination (left). Quantification of neurofilament-light chain levels in the plasma of sham-treated, EAE-induced and EAE-induced mice that were additionally treated with Fingolimod. (n = 6 per group). One-way ANOVA followed by Tukey’s post hoc test. Mean + SEM. **p<0.01; ***p<0.001.
Contact us today to get your study in the EAE-induced mouse model started!


