Interested in plaque-associated inflammation?
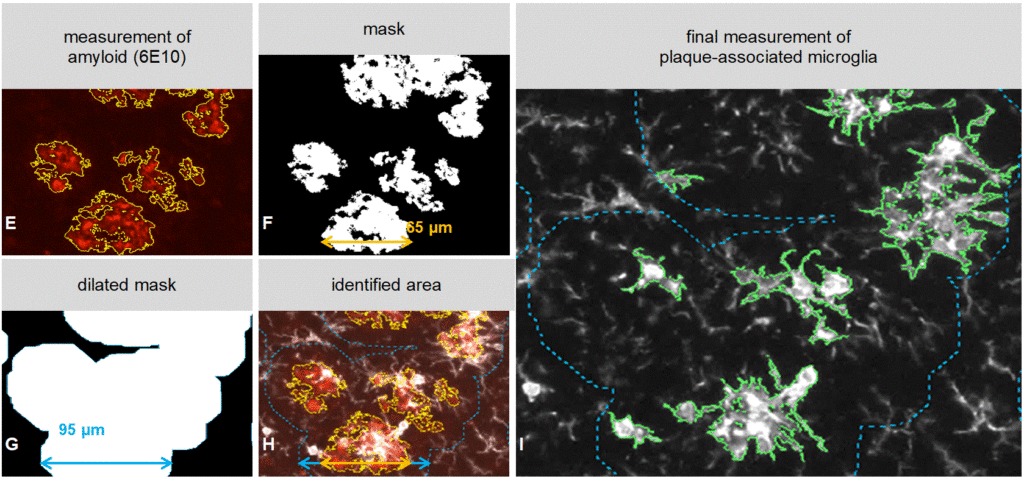
Scantox is your partner for visualization and quantification of plaque-associated inflammation. Figure 1 shows an exemplary quantification process to evaluate microglia (Iba1 labeled) adjacent to amyloid-beta plaques (6E10 labeled).
Multichannel immunofluorescence (up to four different antibodies plus DAPI labeling in one experiment), whole-slide imaging, and quantitative image analysis, allows detailed evaluation of pathological changes.
The image analysis is macro-based using Image-Pro 10 software, enabling fast and cost-efficient quantification of large batches of images. Importantly, the results are operator-independent and fully reproducible.


Figure 1: Immunolabeling of 10 month old 5xFAD mouse brain section and the analysis process to quantify plaque-associated microglial activation. A: Merged signal of amyloid-beta (6E10 in red) and microglia (Iba1 in white); cell nuclei are labeled with DAPI (blue). B-D: Single channel images of 6E10. Scale bar: 50 µm. (B), Iba1 (C), and DAPI (D). E-I: Quantification process: First, 6E10-immunoreactive positive objects (plaques) are identified by adequate thresholding and morphological filtering (E). Second, mask images of the evaluated 6E10-positive area are created (F) and the borders of 6E10-positive objects are extended by 15 µm in all directions (G, H). Finally, Iba1-positive objects (activated microglia) are quantified in the vicinity of amyloid-beta plaques (I).
Contact us today to get your Alzheimer’s disease study tissue analyzed for plaque-associated inflammation!


