The importance of microglia, the resident brain macrophages, in neurodegenerative diseases is well-known and these cells are therefore frequently used as a target for new pharmacological interventions.
At Scantox, cell isolation of early postnatal microglia from mice is a well-established and standardized method for in vitro analysis of this specific cell type.
In addition, we recently set up a method to isolate microglial cells from adult mice by Magnetic Cell Sorting (MACS). Generation of a pure microglial fraction from adult brains of transgenic or even compound-treated mice opens a variety of new possibilities to assess the efficacy of treatments. The cell type specific analysis of gene expression, biomarkers or even additional cultivation and stimulation of these cells can answer unresolved questions.
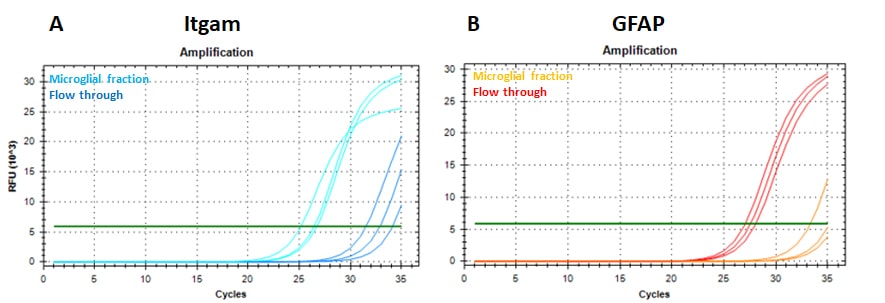
Purity of the microglial fraction in comparison to the fraction containing all remaining cells (flow through, FT) was assessed by mRNA analysis of the microglial marker Itgam (CD11b) as well as the astrocytic marker GFAP (Fig 1). The results show a strong enrichment of Itgam positive cells in the microglial fraction compared to the FT (Fig 1A), in combination with an absence or extremely low contamination of GFAP expression in the microglial fraction (Fig 1B).
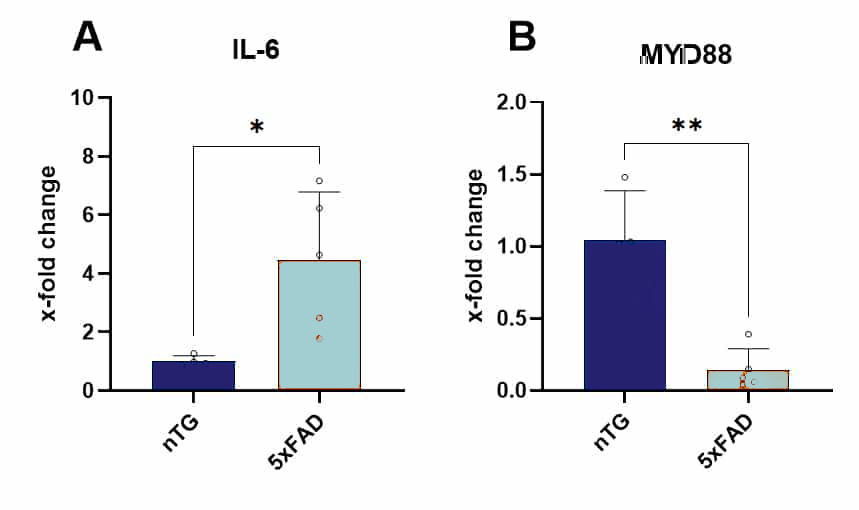
Furthermore, as an example of cell type specific mRNA expression, analysis of IL-6 and MYD88 via RT-PCR was performed in microglia isolated from 5xFAD mice compared to non-transgenic littermates (Fig.2). Interestingly, a high increase in IL-6 expression is accompanied by a reduced MYD88 expression level in microglia of aged 5xFAD mice.

Figure 1: RT-PCR amplification graphs of (A) Itgam and (B) GFAP SYBR green signal in 3 microglia and flow through fractions prepared from 3 separate 9.5 months old mouse brains. The graph shows relative fluorescence units (RFU) of the SYBR green signal per cycle.

Figure 2: IL-6 and MYD88 mRNA expression level in microglial fraction of non-transgenic (nTG) and 5xFAD mouse brains at 9.5 months of age. Data are given as x-fold change compared to nTG mice and shown as bar graphs +SD (n=4-5 per group). Statistical analysis: unpaired t-test. *p<0.05; **p<0.01.
Contact us today to get microglia of your in vivo model isolated!


